

Free Lunch Friday #5: Technical analysis 101, diversified portfolio & National Bank Brokerage
Free Lunch Friday #5: Technical analysis 101, diversified portfolio & National Bank Brokerage
Summer is almost over and since school is restarting, we're tackling harder topics for the next year. Hide your smartphones and pull out your calculators!

Howdy financial wizards! This month, I’m going to introduce you to technical analysis of stocks, how to build a diverse portfolio, and show you the online brokerage I’m using to trade stocks. If you have any suggestions of topics you would like me to tackle, let me know!
Introduction to technical analysis
Did you ever wish to predict the movement of a stock, so you could buy or sell for a profit? Of course right? Unfortunately, I’m not going to show you how to do that, but today we’re dipping our feet in the complicated world of technical analysis.
Keep in mind that predicting market trends is incredibly difficult. There’s two main types of analysis in the stock market: Fundamental and technical analysis. Technical analysis is about studying past market charts in order to predict future performances.
In this section, I’m going to explain to you a few concepts of technical analysis, but you can find more info throughout the text if you want to learn further about this.
Candlesticks charts
A candlestick represent 24 hours of price movement. The top of the candlestick means the highest price the stock value was on that specific day.
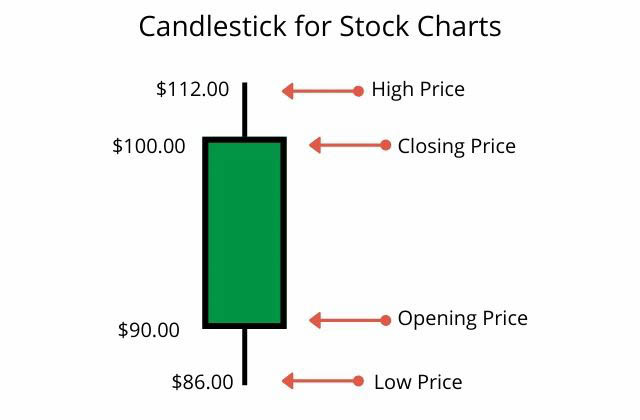
The same goes for the lowest price. The green (or red) bar is the difference between the opening price and the closing price of the stock. So if the opening price is lower than the closing price, the candle will be red instead of green.
Candlesticks give a more specific view of stock prices than other charts.
Predicting trends with candlestick charts
Ok so, now that you understand candlesticks, know that you can predict market trends with them. Let’s start with market movements:
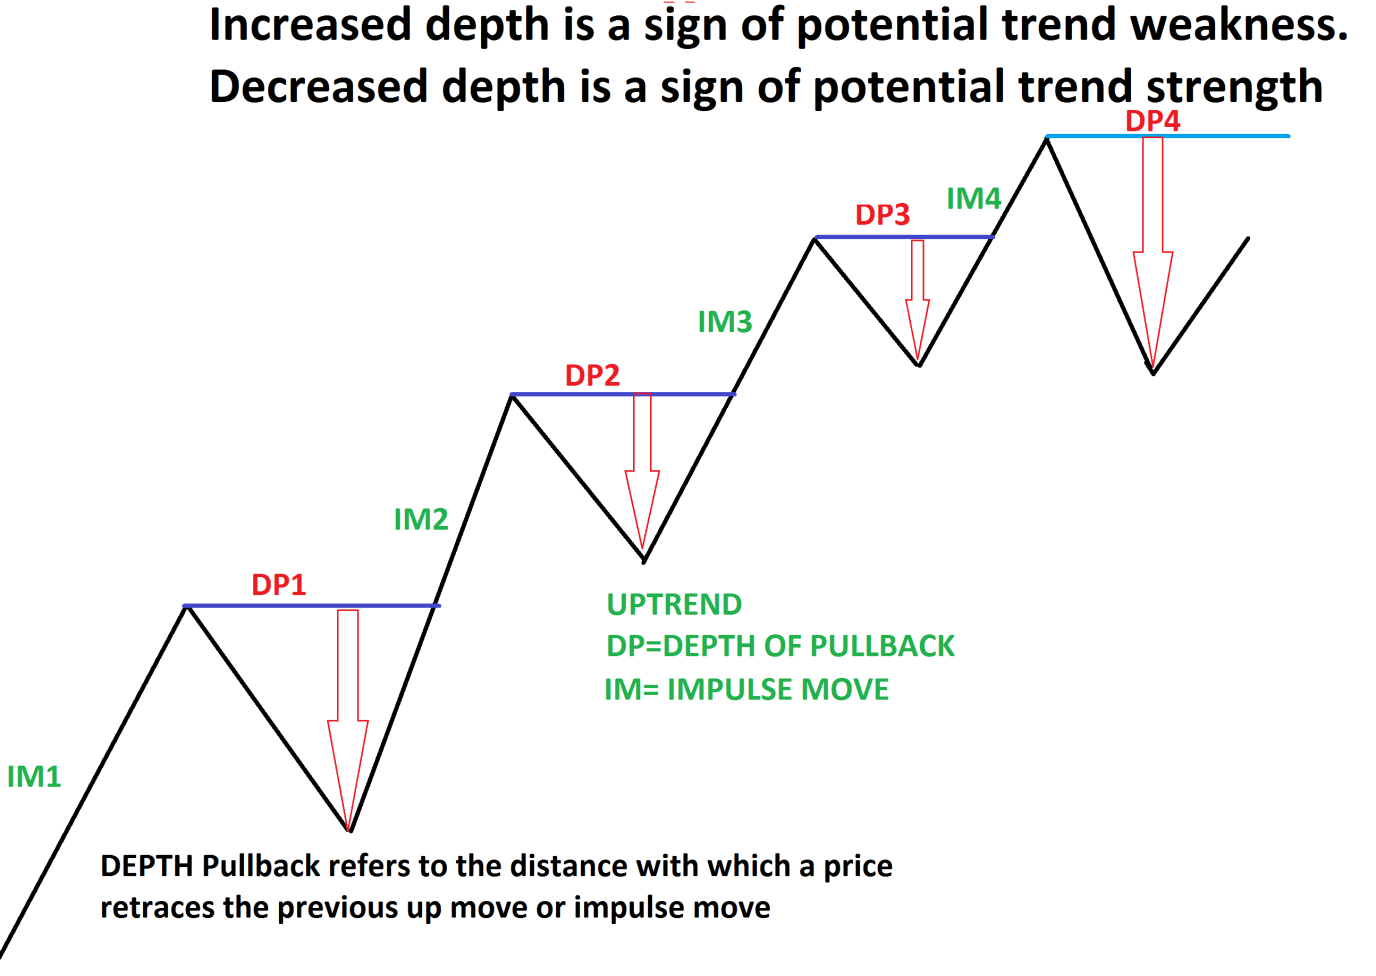
In this example, we’re on a uptrend market. When the trend follow the direction of the market (price increase vs uptrend market), we’re calling that an impulsive move (IM).
When it’s decreasing or increasing on a downtrend market, we’re talking about a pullback (DP).
If the next pullback doesn’t go past the top of the previous impulsive move, the market keep being uptrend. As long as it stays that way, the market is considered uptrend.
However, in the example, DP4 go past the previous lowest low of DP3. That means that there’s higher chances of market reversal and ultimately, a downtrend market.
Support and resistance
Support and resistance are the names we use for “zones” that can be entry or exit points of previous trends that can help understand the future trends of the market.
When a market is uptrend, the support zone is when the price bounce-back up instead of going towards a downtrend pattern (as seen in the illustration).
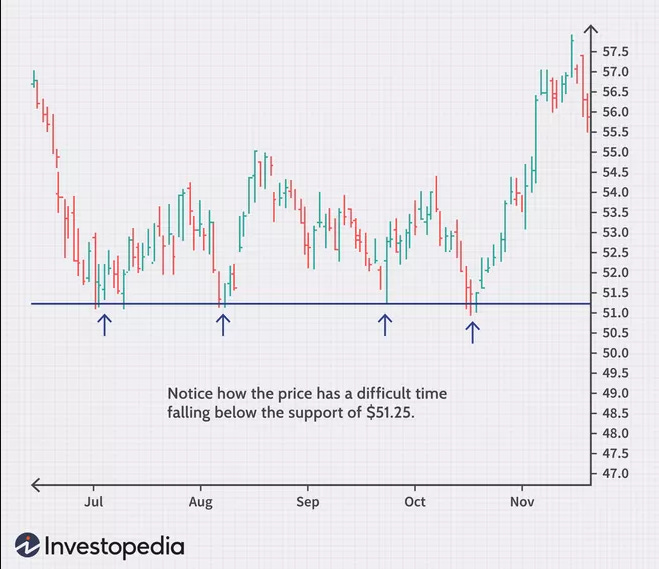
As you can see, once there’s a market reversal the support line in uptrend become resistance in the downtrend. It’s a good indicator to understand the entry or exit points.

So let’s just keep in mind that in a downtrend, we’re looking for resistance to break and then become support after a market change. And in a uptrend market, it’s the opposite.
That’s the basic of technical analysis, you can learn more about it but keep in mind that the majority of investors trying to predict trends are unsuccessful at it.
How to build a diverse portfolio
In investing, we often talk about diversification as a risk mitigation technique that attempt to reduce losses. It can work pretty well depending on your diversification.
If you think that having five penny stocks from different industries is diverse, that won’t save you from your losses. Let’s see the three elements to take into account when building a diverse portfolio:
Market sectors
Choosing different sectors is a must to build a diverse portfolio. If you’re a big tech fan, that’s great, but if the entire technology sector is down (kinda like now), your portfolio performance will be red all over.
Going with other sectors like energy, industrial, customer goods or commodities can make sure your investments are not all in the same baskets and that some sectors will outperform the others at different points in time.
Market cap groups
Market caps are how we categorize different size of stocks. By having different market caps in your portfolio, you can minimize (or increase) the risks based on the company size.
Mega: We all know mega companies such as Amazon(AMZN), Apple(AAPL) & Google(GOOG). Those are companies with over 200 Billions in market value. They are considered low risk investments.
Large: Slightly risker than mega, the large market caps include companies between 10 and 200 Billions. Starbucks(SBUX) & General Electric(GE) are low risk investments.
Mid: We’re talking about Alimentation Couche-Tard(ATD-B) and Bath & Body Works(BBWI). These investments are considered medium risk and the range is between 2 and 10 Billions.
Small: Between 300 Millions to 2 Billions, we fall under the high risk investments with Air Canada(AC.TO) and Dynavax Technologies(DVAX). Buying shares under this market caps require serious research.
Micro: These companies are under 300M, recently IPOed and are very volatiles. It’s important to avoid fraudulent stocks because of the huge volume on the market but it’s difficult because of the lack of information.
Investment options
And finally, what options do you want to invest? You can cherry-pick individual stocks, invest in ETFs, choose index funds or go with mutual funds. Let’s see the difference between them:
Individual stocks: Investing in a singular company, like you buying Tesla stocks.
ETFs: Basket of securities that track an underlying index. You might select a growth ETFs with parts of Tesla stocks. This investment option is usually the most diverse by default.
Index funds: Portfolio of stocks or bonds designed to mimic the composition and performance of a financial market index. They are similar to ETFs but differs on costs, taxes, and minimum to invest.
Mutual funds: Group of stocks actively managed by team. Bit of a disclaimer here, but I don’t recommend mutual funds because of the high management fees and that they often require a minimum to invest.
If you have a mix of the following elements, you’re one step closer to have a diverse portfolio. It’s important to understand what are your financial goals because a diverse portfolio will help you in the long run, but it depends of your investment horizon.
My watchlist - Sponsored by Stratosphere*
BAM | Brookfield Asset Management owns and manages commercial property, power and infrastructure assets. They have an amazing valuation, lots of growth and it’s a quality business in terms of competitive advantages. However, they have low margins and an lower score on the balance sheet side. This is a company to watch and possibly add to diversify your portfolio (now that you know how!).
ATD-B | Alimentation Couche-Tard is a slowly becoming a behemoth in the convenience store industry. What I love with Couche-Tard, except that they are everywhere in Québec, is that their valuation and potential growth makes it really exciting of having them in my portfolio. The dividends part is also great because you can leverage DRIP and make even more returns.
How do I know so much about these tickers you ask? Simple, I’m building my watchlist with Stratosphere*. It’s the #1 platform to research stocks and you can find all of the relevant information you need to do your next “big win”.
*I’m an affiliate of this product and I might be getting commissions if you register.
Financial software of the month: National Bank Direct Brokerage

I decided to share the platform I’m using to invest. It doesn’t need to be yours but I still wanted to show why I’m using it and the perks of it. Let’s get started:
Direct brokerage by the National Bank of Canada is a straightforward platform to get started, but still has few features on the complicated side for later. As a Canadian, you can sign-in pretty quickly and open TFSA in USD to trade your favorite US stocks.
What I love about this platform are two things: the $0 transaction fees and the customization. You can filter the views you want based on your priorities. On my end, I like to see a global view of my performance, but I also like to dig around to know what my yearly yield look like as well.
National Bank can do pretty much everything than classic trading platforms, and they were the first to introduce 0$ transactions and fees. I’m only paying MERs (Management expenses ratios) on my ETFs and that’s it. No limits or anything cumbersome about my investments. The only cons I find is the fact that they don’t have a mobile app, but if you invest for the long term, this become a pros really quick in bear markets.
If you want to switch or simply open an account, check out National Bank Direct Brokerage.
That’s all for this month folks! If you learned something, please share with your friends that are interested in investing and personal finances.
Note that I am not an investment professional, and this is not investment advice.